
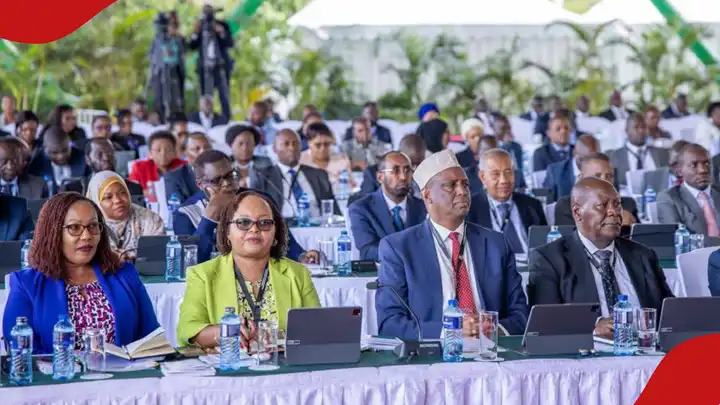
The National Treasury has released its exchequer statement for the first five months of the 2025/26 financial year. Kenyan governors during a devolution summit. According to the gazette notice publiished by Treasury CS John Mbadi, the exchequer has issued KSh 136.95 billion to counties, out of the budgeted KSh 415 billion for the financial year. The disbursement data, published in a gazette notice by Treasury CS John Mbadi, reveals significant variations in the amounts received by the 47 counties based on their approved annual budgets. Which counties received the highest allocations? Leading the disbursement list is Nairobi City County, which received KSh 7.07 billion from its annual equitable share estimate of KSh 21.42 billion. Turkana County followed closely, receiving KSh 4.58 billion against its annual budget of KSh 13.89 billion, while Nakuru County was third, with KSh 4.77 billion disbursed from a KSh 14.46 billion annual estimate. Other top recipients include Kakamega County (KSh 4.51 billion), Kiambu County (KSh 4.31 billion), Kilifi County (KSh 4.23 billion), and Mandera County (KSh 4.05 billion). Notably, all counties received approximately 33% of their original estimates. County Governments – Equitable Share (Original Estimates vs Cash Released) Code County County Governments-Equitable Share Original Estimates (KSh.) % of Amount Issued by Exchequer (KSh.) 4460 Baringo 7,083,683,384.00 2.34b (33.00%) 4760 Bomet 7,447,200,499.00 2.46b (33.00%) 4910 Bungoma 11,838,054,666.00 3.91b (33.00%) 4960 Busia 7,956,564,058.00 2.63b (33.00%) 4360 Elgeyo/Marakwet 5,515,146,712.00 1.82b (33.00%) 3660 Embu 6,077,441,672.00 2.01b (33.00%) 3310 Garissa 8,877,784,676.00 2.93b (33.00%) 5110 Homa Bay 8,646,376,063.00 2.85b (33.00%) 3510 Isiolo 5,631,357,298.00 1.86b (33.00%) 4660 Kajiado 8,894,254,886.00 2.94b (33.00%) 4810 Kakamega 13,674,848,566.00 4.51b (33.00%) 4710 Kericho 7,178,668,356.00 2.37b (33.00%) 4060 Kiambu 13,071,817,986.00 4.31b (33.00%) 3110 Kilifi 12,813,396,770.00 4.23b (33.00%) 3960 Kirinyaga 6,151,661,892.00 2.03b (33.00%) 5210 Kisii 9,819,721,768.00 3.24b (33.00%) 5060 Kisumu 8,902,026,938.00 2.94b (33.00%) 3710 Kitui 11,503,907,837.00 3.80b (33.00%) 3060 Kwale 9,078,699,643.00 3.00b (33.00%) 4510 Laikipia 6,104,082,008.00 2.01b (33.00%) 3210 Lamu 3,857,621,205.00 1.27b (33.00%) 3760 Machakos 10,179,132,681.00 3.36b (33.00%) 3810 Makueni 8,976,335,654.00 2.96b (33.00%) 3410 Mandera 12,265,064,993.00 4.05b (33.00%) 3460 Marsabit 8,105,669,078.00 2.67b (33.00%) 3560 Meru 10,553,946,059.00 3.48b (33.00%) 5160 Migori 8,883,939,719.00 2.93b (33.00%) 3010 Mombasa 8,383,385,281.00 2.77b (33.00%) 4010 Murang’a 7,969,464,876.00 2.63b (33.00%) 5310 Nairobi City 21,417,128,397.00 7.07b (33.00%) 4560 Nakuru 14,455,147,658.00 4.77b (33.00%) 4410 Nandi 7,771,778,066.00 2.56b (33.00%) 4610 Narok 9,770,317,146.00 3.22b (33.00%) 5260 Nyamira 6,073,434,356.00 2.00b (33.00%) 3860 Nyandarua 6,662,675,631.00 2.20b (33.00%) 3910 Nyeri 6,896,132,673.00 2.28b (33.00%) 4210 Samburu 6,336,970,364.00 2.09b (33.00%) 5010 Siaya 7,754,478,885.00 2.56b (33.00%) 3260 Taita/Taveta 5,760,449,685.00 1.90b (33.00%) 3160 Tana River 7,222,474,730.00 2.38b (33.00%) 3610 Tharaka – Nithi 5,058,286,293.00 1.67b (33.00%) 4260 Trans Nzoia 7,991,120,837.00 2.64b (33.00%) 4110 Turkana 13,892,577,371.00 4.58b (33.00%) 4310 Uasin Gishu 8,977,014,770.00 2.96b (33.00%) 4860 Vihiga 6,008,751,224.00 1.98b (33.00%) 3360 Wajir 10,507,580,683.00 3.47b (33.00%) 4160 West Pokot 7,002,426,007.00 2.31b (33.00%) Total Issues – Equitable Share (Note 3) 415,000,000,000.00 136.95b (33.00%) The allocations reflect the distribution formula based on population, poverty levels, land area, and other parameters defined by the Commission on Revenue Allocation (CRA).
Source: TUKO.co.ke